Subset the data by

Measured N2O Data
Sites Climate Data
Nitrous Oxide is a heavily researched topic, but the methodologies used vary drastically, making it difficult to compare studies. This page includes
four different meta-analysis, as well as a homegrown dataset, that allow you to explore sites and examine what the EF is across a range of sites and conditions. At this point, annual emissions
estimates are taken from the respective meta-anlysis, and thus there is no consistent methodology in calculating the annual emission. The meta-analysis are;
Shcherbak et al., 2014 - Nonlinear responses
Verhoeven et al., 2017 - Biochar
Cayuela et al., 2017 - Mediterranean N2O
Albanito et al., 2017 - Tropical N2O
Solid black line is the regression for the selected data. Dashed red line is the IPCC N2O regression of 1%, with a background of 1 kgN2O-N/ha-yr.
Summary info for the selected information
Breakdown statistics of sites in the meta-analysis'
About the Global N2O database
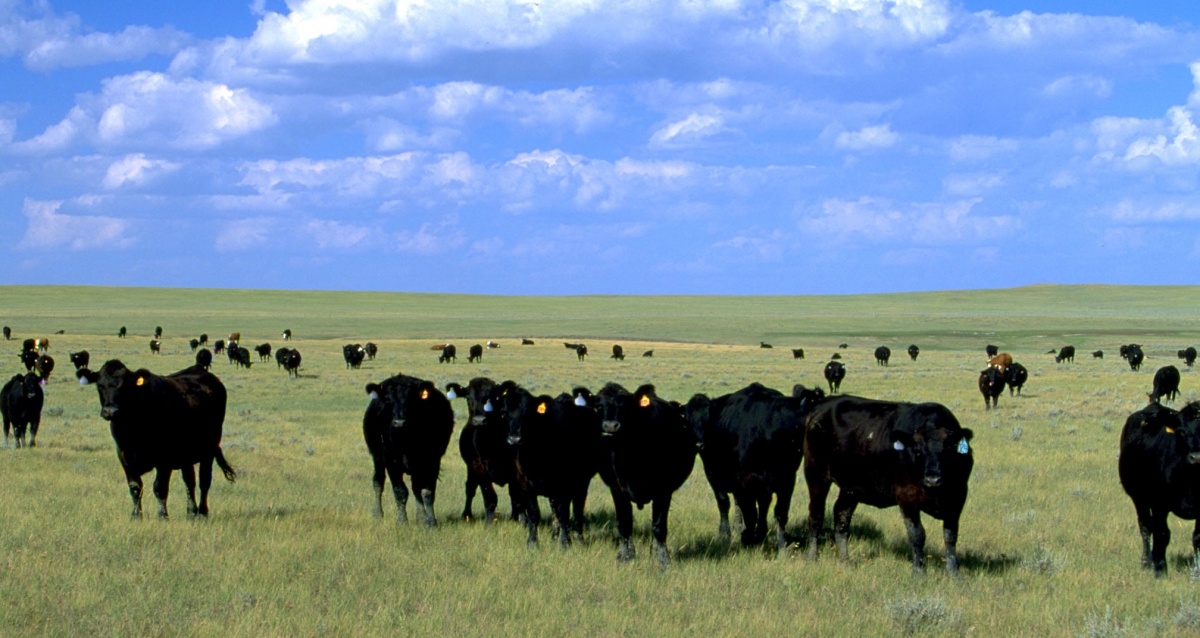
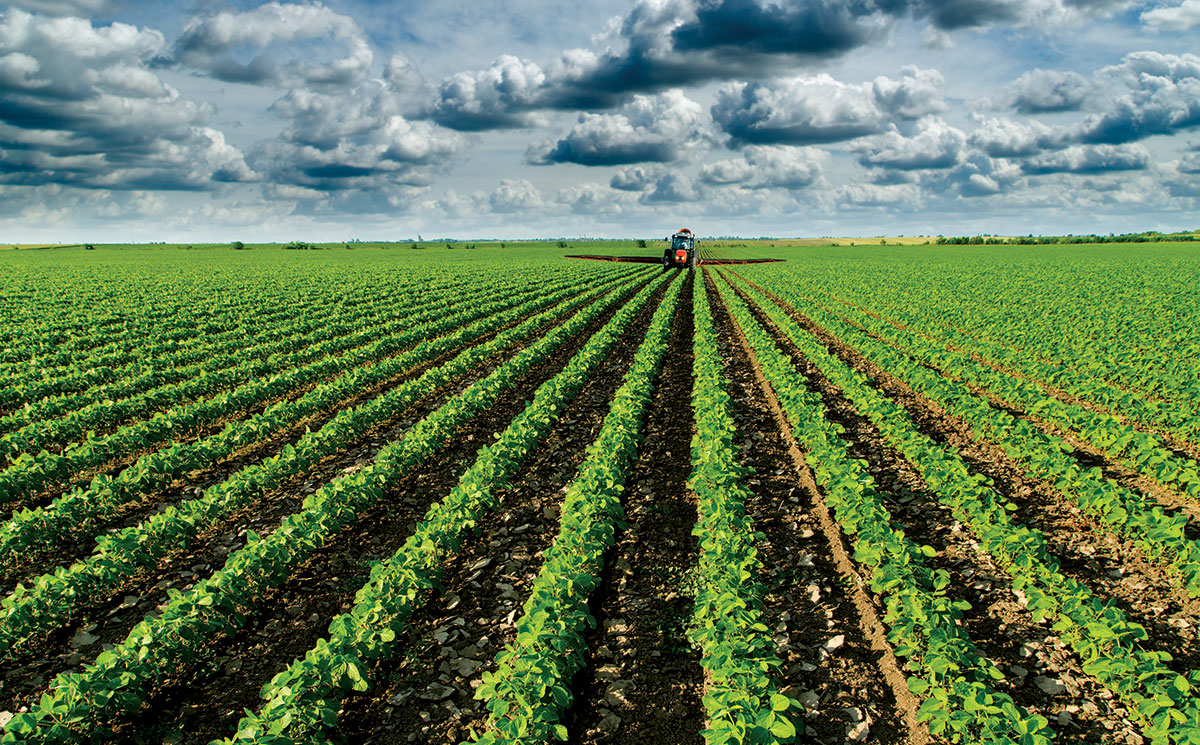
Intensification of crop production, at least in part through increased nitrogen inputs (and the associated N2O production), is essential for feeding a growing and hungry planet.
This makes N2O emissions an important research area as N2O is a potent greenhouse gas (GHG), with agriculture representing the largest source of N2O emissions.
Nitrous oxide emissions are notoriously variable - through time, across space, and with management and environmental conditions.
Time and budgetary constraints force compromises in N2O emission sampling extent, frequency, and duration with field measurements of N2O emissions typically carried out only during the growing season and at a roughly bi-weekly time scale.
Given the episodic nature of N2O emissions, spotty measurements can easily result in unreliable N2O estimates, especially when field measurements are extrapolated to annual values (Reeves and Wang, 2015; Barton et al., 2015).
Sampling and data analysis have therefore proven difficult and techniques used for gap filling missing data and extrapolating measurements have largely been inadequate or ignored.
Analysis efforts primarily focus on examining a single site with methods not carrying over between sites.
In order to address concerns around N2O emissions, improve methods and estimation techniques, and set up mitigation pathways we need a more comprehensive research analysis to better understand N2O emissions.
There are hundreds of sites globally that have N2O emission data. However, methods vary across sites with a large variety of systems being examined. A coordinated infrastructure is needed to transform that data into knowledge. That infrastructure is met by a database that provides people (access, contributions, support), hardware (sustainable, universal, interoperability, accessible), and tools (analysis packages, new methods)
in order to better understand, analyze, and provide solutions around N2O emissions. Please contribute data to the global N2O database in order to increase our understanding and capabilities around N2O emissions.
Davidson et al (2000) outlined our understanding of how Nitrous oxide is emitted with the hole-in-the-pipe model for explaining how N2O leaks out of the nitrogen system. This publication still provides a strong understanding of our current understanding on emissions. However, this is not the only leak in the system. There are several leaks in the knowledge and science around N2O emissions that we must improve on in order to take individual, isolated data points and turn them into knowledge. The figure on the right explains these gaps in knowledge. We go into a research project with great ideas (eg, problem: N2O emissions occur at a high rate under annual crops with high fertilization rates.
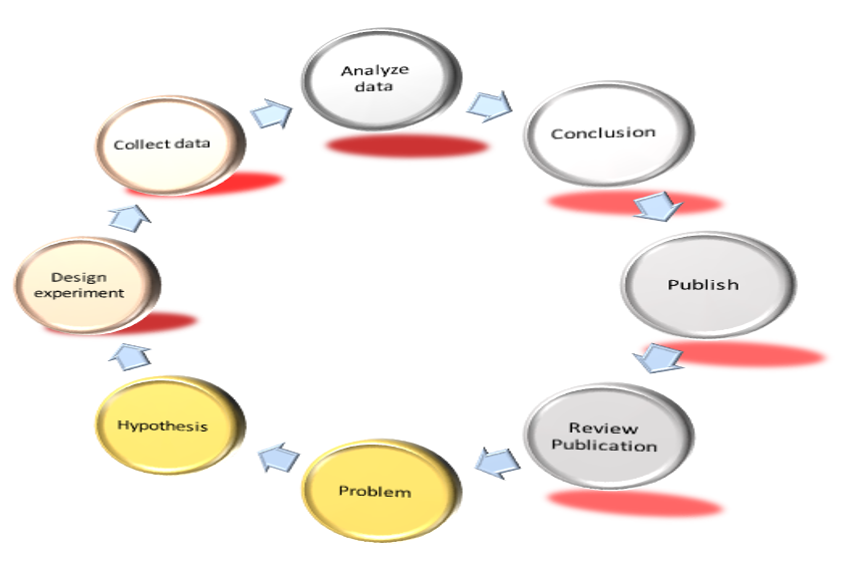
Hypothesis: Cover crops can reduce emissions.) We then design an experiment and must make sacrificies in the process. (eg, using static chambers and sampling once a week instead of using auto chambers). The collected data then gets analyzed with a linear regression between points, ignoring the large spatial and temporal variability in emissions. We publish a field trial that could have a better estimate if we had improved methods. This then gets into methods and continues to be used. This environmental data often ends with its publication. While another study may base its hypothesis on previous work or there will eventually be a review publication, there is often not enough follow through or cross collaboration between sites. This leaves potential solutions out of reach or can lead to improper analysis in future data. Due to the limitations mentioned, many studies sample only bi-weekly and only during the growing season. However, we know hotspots and hotmoments, winter emissions, and edge seasons can potentially play a large role in emissions. Gap-filling and extrapolation for when this data is missing are not well addressed and poorly understood, despite having huge ramifications in terms of annual emissions. These leaks in the pipe of knowledge can only be achieved through open science that is reproducible, reliable, and flexible. Which includes clearly stated methods and analysis. The Global N2O Database hopes to patch those leaks in the pipe through a global collaboration to improve our understanding aroud N2O emissions. We hope you consider contributing data to the database in order for research to be done that can improve analysis and methods around N2O emissions. Improved estimates and methods could further lead to effective solutions for mitigating N2O emissions while intensifying agriculture sustainably and providing food for a growing planet. The Global N2O Database will also provide access to data as well as scripts, analysis methods, and more so that our learning and understanding doesnt end with this project but sets the basis for another golden hypothesis around N2O emissions.
Stay in touch and get updates by joining our mailing list here. Or emailing us.
The Global N2O database is funded by the following:

We are looking further into methodology and practices in order to comply with best management practices regarding data sharing and storage, providing citation/credit, and accessible and open science. If you are a part of one of these organizations, please do not hesitate to reach out as we work to build a top of the line scientific database product. We are currently looking into fairsharing.org, Creative commons, Ecological metadata language, core trust seal, and others to ensure we are using the best practices.


Instructions for how to use the interactive Map:
Not all features in the map are currently operational as we working on building the website and incorporating data. Below are instructions on what is available and how to use this site currently;
-
Of the drop down menus, only Crop and Irrigation are working at the moment, while the rest are placeholders for future website development
-
Sites that have been selected by the drop down menus will show up as pins.
-
Sites that have had data uploaded to the database show up as pink circles, while all known sites show up as block circles. Currently these are the GRACEnet sites as well as some others.
-
Click on any circle in order to get site and crop information for that site.
-
The colors overlaid on the map are the IPCC climate zones.
Stay tuned for more information as we update the website.
If you have suggestions please email us!

The Global N2O Database Steering Committee
The steering committee is designed to provide scientific integrity, methods and scientific design and expertise around Nitrous oxide emissions. To provide guidance, monitoring and advice in the examination and improvement of nitrous oxide emissions.

Rich Conant
Associate Professor
Natural Resource Ecology Lab
Department of Ecosystem Science and Sustainability
Colorado State University
USA

Chris Dorich
Research Associate
Natural Resource Ecology Lab
Colorado State University
USA

Fabrizio Albanito
Research Fellow
University of Aberdeen
U.K.

Peter Grace
Professor
Queensland University of Technology
Australia

Val Snow
Research
AgResearch
New Zealand

Tony VanDer Weerden
Research..
AgResearch
New Zealand

Iris Vogeler
Research..
Plant and Food Research
New Zealand

Klaus Butterbach-bahl
Professor
Karlsruhe Institute of Technology
Germany

Clemens Scheer
Research..
Karlsruhe Institute of Technology
Germany
Support Staff:

Daqi Wang
Daqi works for the Global N2O Database as the main programmer for incorporating new sites into the database as well as testing methodology around gap-filling methods.
Daqi is a recent graduate from the CSU-MGMA masters degree program

Benjamin Fehr
Ben worked with us for the Summer of 2019 as an USDA-NIFA REEU student where he worked on setting up artificial neural networks (ANN) for examining gap-filling and improved methodology of N2O estimates.
What kind of data can be uploaded to the Database?
We are interested in all data related to N2O emissions. We hope this database will be an expensive examination of N2O, allowing researchers like you to fully explore the available data, hopefully leading to some great mitigation practices. Below are specific data types and examples that we are currently working with and are actively working on incorporating. If you have data that isn't included below please contact us about getting the data incorporated.
-
Any and all Greenhouse Gas emission data (preferably with all replicates)
Chamber data (manual and auto chamber)
-
Micro Met data
-
Lab data (incubations,etc)
-
Isotope data
As well as associated meta and supporting data:
-
Soils data (texture, soil moisture & temperature, pH, bulk density, C & N, etc)
-
Weather data
-
Management data
-
Yield data (yield, CN ratio, harvest info, crop partitioning, growth over time, etc)
-
Isotope data
-
Microbial data
-
Nitrogen deposition and leaching
How to upload Data:
The success of the Global N2O Database and improving our understanding and estimates around emissions depends on you! In order to improve methods we need a large data set in order to really examine emissions data. Improving our understanding and realizing better mitigation strategies is vital step in combating climate change. Please help us by contributing and using the data within this database!
Below is our excel sheet for uploading data. Click the download button below, input your data and send the file back to us!
Download Field Data sheet
Please do not hesitate to email us if you have any questions. If you have multiple field sites in another format please contact us about passing along your currently formatted data to save you time!
Please email filled in sheets (or questions) to global_n2o_database@lists.colostate.edu Thanks!
Global N2O Database: Data Policy
Purpose
Intensification of crop production, at least in part through increased fertilizer inputs, is essential for feeding a growing and hungry planet. Increasing yields while reducing N2O and other N losses is a vital step in increasing the efficiency of reactive nitrogen within agriculture and sustainably intensifying agriculture. Accurately measuring and estimating N2O emissions from agriculture is a large part of this. Nitrous oxide emissions are notoriously variable - through time, across space, and with management and environmental conditions. Sampling and data analysis have therefore proven difficult and techniques used for gap filling missing data and extrapolating measurements have been missing or are inadequate. This database and resulting work are intended to lead to improved methodologies around daily and annual N2O estimates. Improved estimation methods will allow for analysis of mitigation practices and new pathways for future research around reducing the release of reactive N and improving soil health by improving N2O estimates and methodologies.
Policy on Data Contribution
We encourage researchers to contribute field or lab measured N2O fluxes from all sampling methods to this publically available Global N2O database. Data contributors maintain full rights and ownership to their data. Data (consisting of weather, soil, management, crop, environmental, GHG data, and more) can be contributed by using the request_for_FieldData template. If you have a network of sites in a different format that you would like to contribute please contact us to see about uploading your data from your current format.
Data will be maintained at several levels:
Level 1 - All field data are publicly available, with field data supplied down to the replicate level
Level 2 - All field data are publicly available, with field data supplied as average of replicates with standard deviations on replicates
Level 3 - Some of the data are restricted from public use, with a separate publicly available section provided on the database
Level 4 - Potential data providers. Known N2O research sites and measurements that have not been contributed to the database yet. Summary information gleaned from a publication will be posted. We encourage data providers within this level to submit further data in order to get further access to the database and to improve the communities knowledge about N2O.
Use Policy
To use data, the user must register with the Global N2O database and agrees to use data in a way that supports the mission and guidelines established by the database charter. Reasonable effort must be taken by data users to contact data providers of the work they are interested in using and must acknowledge and cite work as meets scientific standards and practices.
The Global N2O database is for research purposes only and data will not be used for commercial purposes without first discussing potential outcomes and uses of the product with the database.
Data Transfer
If in the process of using the Global N2O database you transfer data to another source (ie, other databases, networks, synthesis, meta-data efforts, etc), use is subject to the following:
- All citations and acknowledgements must be transferred with the data so that the original contributors are credited as well as the Global N2O database.
- The users of potentially transferred data must make reasonable efforts to require users to abide by the Global N2O database citation policies. Users must also maintain communications and a list of users for the transferred data with the Global N2O database. Any future users of transferred data are encourage to join the Global N2O database to further communication, transparency, and collaboration.
- The Global N2O database maintains the right to transfer the complete database to another party in order to preserve the database, better distribute the data, or prolong its life and capacity. If this occurs, all effort will be taken to preserve the Global N2O database name and common citation for continuity
Citation Guidelines
- Cite the Global N2O database, including references to the specific data sources used and a download date. Eg; Dorich, C.D., Conant, R.T., Albanito, F., Grace, P.R., Snow, V., van der Weerden, T., Vogeler, I., 2018. Global N2O database, Automated chamber data, Accessed July 3, 2018.
- Cite each contributor whose data you accessed through the Global N2O database using the standard citation practices for the journal that you are submitting to.
Acknowledgement Guidelines
Please include the following text in your acknowledgement sections:
"This work included use of the Global
N2O database"
Please notify the Global N2O database of any current or pending publications and efforts that you developed with use or support from the database.
Contact
This data policy was created by the Global N2O database steering committee. If you have any questions or concerns please contact us at global_n2o_database@lists.colostate.edu
Charter
Scientific Steering Committee
Global N2O Database
Mission Statement: To improve N2O knowledge and estimates through improved methodologies and the use of a publicly available global N2O database.
Introduction
Nitrous oxide is a potent greenhouse gas (GHG) - 300 times more potent than CO2. Agriculture is the largest source of N2O emissions, with agricultural soils accounting for roughly 6% of anthropogenic warming gases (PCC, 2014). In the United States roughly 75% of N2O emissions come from agricultural production (EPA, 2017). There is substantial interest in N2O reduction from agriculture as a part of the global climate change mitigation strategy (Paustian et al., 2016), yet methods for measuring or estimating N2O emissions remain highly uncertain. Nitrous oxide emissions are notoriously variable - through time, across space, and with management and environmental conditions. Emissions are driven by a combination of conditions including N, carbon, and oxygen availability, soil temperature, water filled pore space (WFPS) as well as other environmental conditions like pH, soil disturbance, or microbial influence (Davidson et al., 2000; Saggar et al., 2013). Because of sampling constraints and the episodic nature of emissions, N2O sampling and data analysis have proven difficult with techniques used for gap-filling missing data being inadequate, if they are used at all (Reeves et al., 2015). Given the episodic nature of N2O emissions, spotty measurements can easily result in unreliable N2O estimates, especially when field measurements are extrapolated to annual values (Reeves and Wang, 2015; Barton et al., 2015). To improve the methodology and estimation practices around N2O emissions we are generating a publically available Global N2O Database in order to advance understanding, analysis, and estimation techniques around N2O emissions. This project will examine relationships between N2O fluxes and environmental conditions to propose new methods for interpolating emission fluxes during periods between measurements in order to provide more accurate estimates of annual emissions.
Goals of the Global N2O Database:
This project will update analysis and interpolation techniques for N2O emissions data leading to better estimates of annual emissions, increased capacity around N2O flux timing, and improved analysis around mitigation practices. This project will close the gap by examining global N2O sites to determine better techniques for gap filling data, provide more accurate methods for estimating annual emissions, and allowing proper comparison of N2O methodologies to field emissions. Examination of the global suite of auto chamber N2O sites and their environmental conditions will likely lead to increased understanding and improved interpolation methods for N2O estimates. Previous efforts have focused solely on examining single sites at a time and methods have not translated to other sites or been tried on other sites.
Scripts and files for uploading data:
We currently are working with an excel file for uploading data. As the database is programmed in R we are also working on an R script for uploading data. If your data is maintained in R, a database or other formats please let us know and we will work on uploading the data in that format.
From GC to Database:
We are working on an R script that will help you take outputs from Gas Chromatographs (GC), analyze the results, and output those results. This will also allow formatting of your data for the database so that extra time will not be required for you to upload data to the database.
Please come back later for more information!

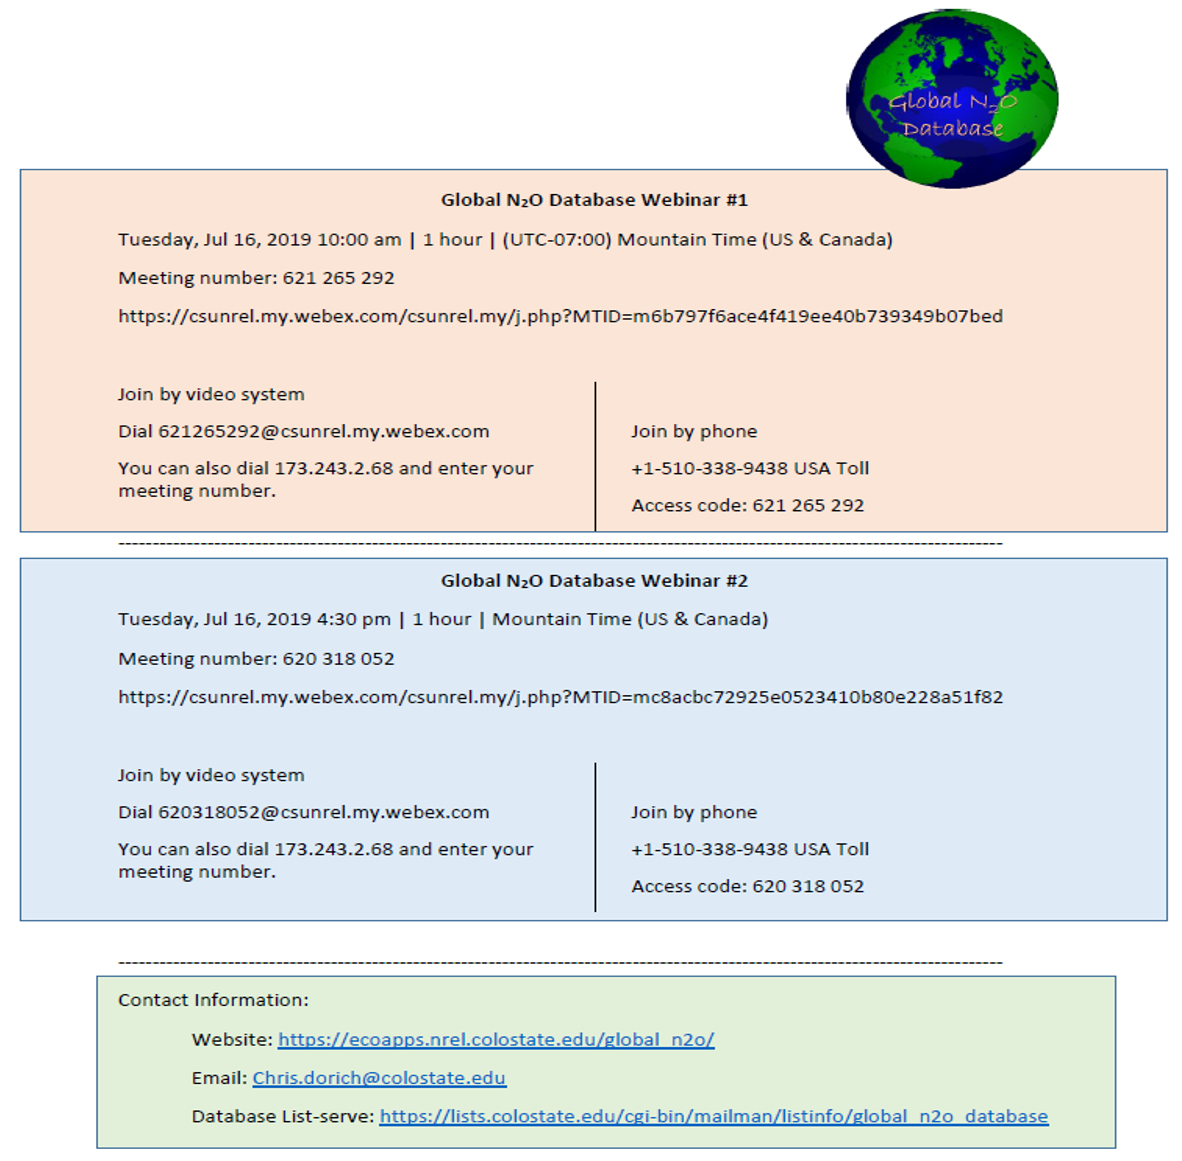
Find us at these upcoming events:
Attend one of our webinars occurring on July 16th, details below:
Stay tuned for details on a codeathon on August 20-22, 2019 as we provide live support for data upload.
8th Global Nitrogen Conference
Berlin, Germany
May 3-7, 2020
Conference info can be found here
Previous events:
OECD Sponsored meeting: Climate change, reactive nitrogen, food security and sustainable agriculture
Garmisch-Partenkirchen, Germany
April 15-16, 2019
Meeting presentations can be found here
AGU Fall 2018 Meeting
Washington, DC
Abstract here
Tuesday, December 11 5:30 - 5:45
Session: (B24C) Biogeosciences, Global and Regional Nitrous Oxide Budget: Data, Models, and Uncertainty II
Walter E Washington Convention Center, 154AB
20th Global N Workshop
Rennes, France